Customized Solution for GIS Software: Manifold
Solar panels
One of our latest customizations was developed for a GIS software solution, specifically Manifold, which I consider one of the fastest GIS tools currently on the market.
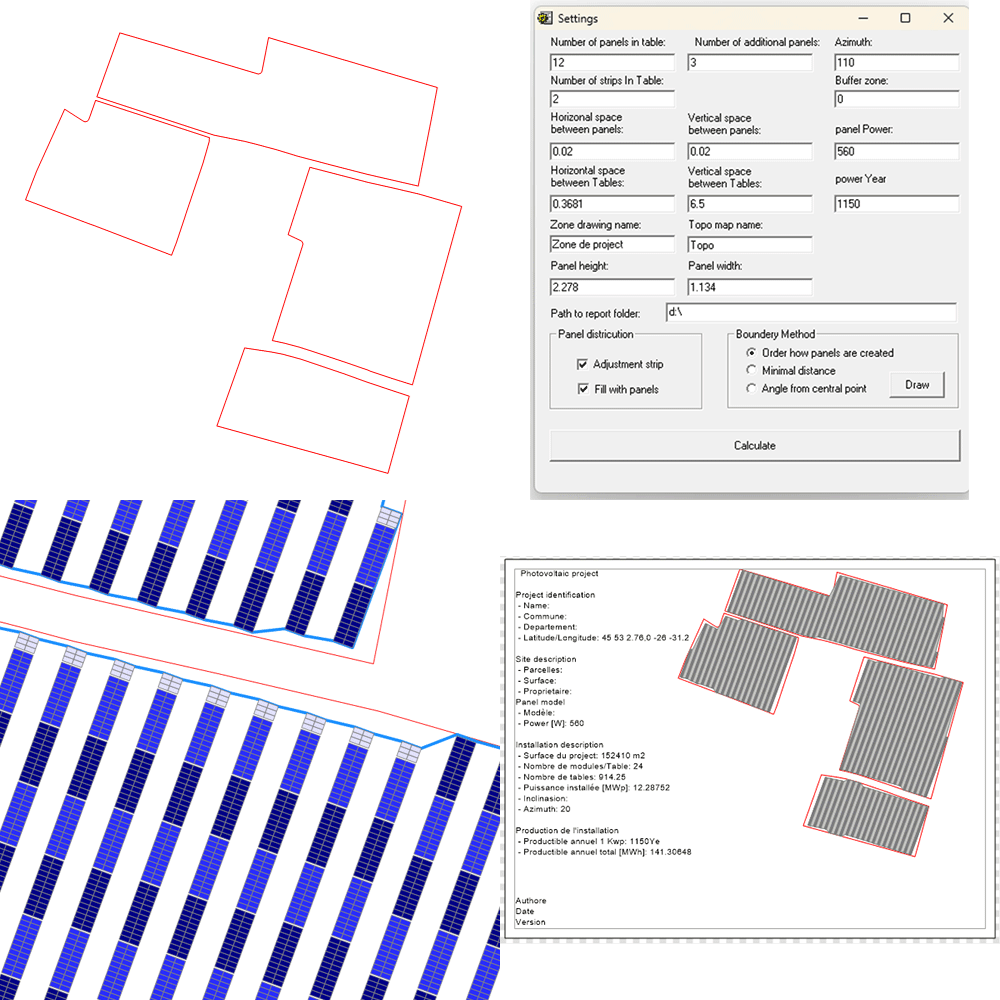
The project involved designing a panel layout for a given project boundary, with the following configurable parameters:
- Number of panel rows within a single table
- Number of panels in each row-strip
- Horizontal and vertical spacing between panels
- Horizontal and vertical spacing between tables
- Panel height and width
- Azimuth angle for panel placement
In addition to the above settings, the positioning of tables within a row offers three options:
- Tables are shifted within the row to ensure equal spacing from the project boundary at the start and end of the row.
- At the end of a row, additional panels can be added to create a non-standard table. The number of these extra panels is configurable, and if space permits, the software will automatically design panels based on the specified settings.
To calculate the occupancy coefficient (defined as the area covered by panels divided by the total area), the software can generate a panel coverage boundary using one of the following methods:
- Minimum distance method
- Panel creation method
- Expanding angle method relative to the central point of the project polygon
Final Deliverables:
- Optimized panel layout for the project
- Defined boundary of panel coverage
- A customized report (layout) tailored to the user’s requirements
